


Transforming Web Accessibility into a Profitable Opportunity
For too long, businesses have viewed web accessibility as a cost center; a necessary expense to meet compliance standards like WCAG and avoid lawsuits. But what if that’s the wrong way to look at it? What if accessibility isn’t just about avoiding penalties, but about actively generating revenue? The truth is, a more accessible website doesn’t just serve users with disabilities; it creates a better experience for everyone. And a better user experience almost always translates to better business outcomes.
Thinking about accessibility as a profit driver requires a shift in mindset. It’s about moving from a reactive, checklist-based approach to a proactive, data-driven one. When you make your site easier to use for people with visual impairments, motor disabilities, or cognitive differences, you’re also making it easier for someone using their phone on a bright day, a power user who navigates exclusively with a keyboard, or a parent who’s multitasking with a child in one arm. These improvements lead to higher engagement, lower bounce rates, and increased conversions.
The challenge has always been proving it. How do you connect the dots between an accessibility fix and a bump in sales? The answer lies in data. By using analytics tools you already have, like Google Analytics 4 (GA4), you can start to measure the impact of your accessibility efforts and show stakeholders exactly how much return on investment (ROI) they’re generating. It’s time to stop treating accessibility as an obligation and start seeing it for what it is: a powerful business advantage.
The Analytics Gap | What Standard Tools Don’t Tell You
Most businesses are swimming in data. Standard analytics platforms are great at telling you about page views, bounce rates, and conversion funnels. They can show you which marketing channels are driving traffic and what content is most popular. But here’s the problem: these tools often miss the “why” behind user behavior, especially for users with disabilities. They don’t come with out-of-the-box reports that tell you how many people are relying on keyboard navigation or how many are using a screen reader.
This creates a significant analytics gap. You might see a high drop-off rate on your checkout page, but your standard reports won’t tell you it’s because the “Complete Purchase” button isn’t accessible to keyboard users. You might notice low engagement with your video content, but you won’t know it’s because the captions are inaccurate or difficult to turn on. Without this specific information, you’re left guessing. You might pour money into redesigning the page or changing the button’s color, completely missing the real issue.
To get a full picture, you need to go deeper. You need to set up custom tracking that specifically monitors interactions related to accessibility features. This isn’t about tracking individual users, which raises privacy concerns. It’s about anonymously aggregating data on how people are using your website’s features. This is the data that closes the analytics gap and gives you actionable information to make real improvements.
Setting Up Your Accessibility Dashboard
Creating an accessibility dashboard isn’t as complicated as it might sound. It’s about deciding what to measure and then configuring your analytics tool to capture that data. By setting up custom event tracking in a tool like GA4, you can start to quantify user interactions that directly relate to accessibility. This allows you to build a dashboard that visualizes the impact of your work, making it easy to share with your team and leadership. The goal is to collect concrete evidence that links accessibility improvements to positive business metrics.
Tracking Keyboard Navigation Patterns in GA4
Millions of users rely on a keyboard, not a mouse, to navigate websites. This includes people with motor disabilities, power users who find it faster, and individuals with temporary injuries. If your site isn’t fully navigable with a keyboard, you’re shutting out a huge segment of your audience. So, how do you know if your site works well for them? You track their behavior.
You can set up a custom event in GA4 that fires whenever a user presses the “Tab” key to move between interactive elements like links, buttons, and form fields. By tracking this, you can start to understand keyboard navigation flows. Are users tabbing through your main menu successfully? Or are they getting stuck in a “keyboard trap” where they can’t tab out of a certain section?
You can also measure the time it takes for a keyboard user to complete a certain task, like filling out a contact form, and compare it to the average time for a mouse user. If the keyboard user’s time is significantly longer, it’s a strong indicator of an accessibility problem. This data helps you pinpoint specific areas of friction and provides a clear case for making improvements.
Measuring Engagement with Captions and Transcripts
Video content is a huge part of the modern web, but it’s useless for people who are deaf or hard of hearing if it doesn’t have captions. Captions also benefit users in noisy environments, people who are non-native speakers, and many others who simply prefer to read along. Tracking engagement with these features tells you how valuable they are to your audience.
In GA4, you can create events to track when users turn on captions, how long they watch with captions enabled, and whether they download a video’s transcript. If you see high engagement with these features, it’s a clear sign that you’re serving your audience’s needs. It also builds a strong business case for ensuring all future video content is properly captioned.
Conversely, if you offer captions but see very little engagement, it might not mean people don’t want them. It could indicate that the button to turn them on is hard to find or doesn’t work with assistive technologies. This data prompts you to investigate further, perhaps by running some usability tests. By tracking this information, you move from assuming features are working to knowing exactly how they are being used.
Identifying Drop-Off Points for Screen Reader Users
Screen readers are software programs that read a website’s content aloud, allowing people with visual impairments to access the internet. A site that isn’t built with screen reader compatibility in mind can be a confusing and frustrating maze. Identifying where these users get stuck or give up is critical for improving their experience.
While you can’t directly detect if a user has a screen reader running (for privacy reasons), you can track interactions with elements that are primarily there for them. For example, you can track how often “skip to main content” links are used. These links are a lifeline for screen reader users, allowing them to bypass repetitive navigation menus and get straight to the good stuff. If this link is used frequently, you know it’s providing value.
You can also get clues by looking at form errors. Set up tracking to see how often users encounter error messages on forms. If a specific field is causing a disproportionate number of errors for keyboard navigators, it’s likely that the field’s label or error message isn’t being read correctly by screen readers. This tells you exactly where to focus your remediation efforts to create a smoother experience and prevent users from abandoning the form.
Monitoring Use of High-Contrast Modes
Many websites now offer a high-contrast or dark mode option. This feature is essential for many people with low vision, but it’s also popular with users who simply find it easier on the eyes, especially in low-light conditions. Tracking the usage of this feature can provide another layer of data demonstrating the need for accessible design choices.
Setting up an event to track clicks on your high-contrast toggle is straightforward. When you see how many people are actively choosing this display mode, you have a clear metric showing its importance. You can present this to stakeholders as evidence that thoughtful design choices resonate with your user base.
Furthermore, you can segment your analytics to see if users who enable high-contrast mode spend more time on your site or have a higher conversion rate. If they do, it’s a powerful argument that providing a more comfortable viewing experience directly leads to better engagement and business results. This isn’t just about a single feature; it’s about a mindset of giving users control over their experience, a core principle of inclusive design.
Case Study – How a Retailer Boosted Conversions by 25%
Let’s look at a real-world (though anonymized) example. An online clothing retailer, “FashionForward,” was seeing a lot of abandoned carts. Their overall conversion rate was stagnant, and they didn’t know why. Their standard analytics showed that users were dropping off at the final step of the checkout process, but it didn’t explain the reason. They decided to conduct an accessibility audit and dig deeper into their data.
The audit revealed several problems. The “size” and “color” selection dropdowns on product pages were not keyboard accessible. The form fields in the checkout process were not properly labeled for screen readers. And the “Confirm Purchase” button had poor color contrast, making it hard to see for people with low vision. These weren’t just minor usability issues; they were complete roadblocks for a portion of their users.
FashionForward got to work. They fixed the keyboard navigation on the product pages, added proper labels to their checkout form, and changed the color of the confirmation button to meet WCAG contrast requirements. At the same time, they set up custom event tracking in GA4 to monitor keyboard interactions on the form and clicks on the final purchase button. The results were stunning. Over the next quarter, they saw a 25% increase in their overall conversion rate. Even more telling, their new analytics showed a 200% increase in completed purchases originating from keyboard-only navigation. They proved that fixing accessibility issues didn’t just help a small group of users; it lifted their entire business.
Connecting Data to Dollars | Building a Compelling ROI Report
Having the data is one thing; presenting it in a way that gets executive buy-in is another. Your stakeholders aren’t accessibility experts. They speak the language of numbers: revenue, profit, and return on investment. So, you need to translate your accessibility data into a compelling business case. Your ROI report should be clear, concise, and focused on financial impact.
Start by establishing a baseline. Before you make any changes, document your key metrics: conversion rate, cart abandonment rate, time on page, etc. As you roll out accessibility improvements, track these same metrics over time. The change you see is the direct result of your work. For example, you can say, “After making our checkout form screen reader compatible, we reduced cart abandonment by 15%, which translated to an extra €50,000 in revenue last month.”
Use visualizations to make your point. A simple line graph showing the conversion rate climbing after an accessibility fix is far more powerful than a spreadsheet full of numbers. Tie your findings back to the bigger picture. Explain how a more accessible website expands your potential market to include the millions of people with disabilities who have disposable income. Frame accessibility not as a cost, but as an investment in market growth. By connecting data directly to dollars, you can change the conversation and secure the resources you need to continue your work.
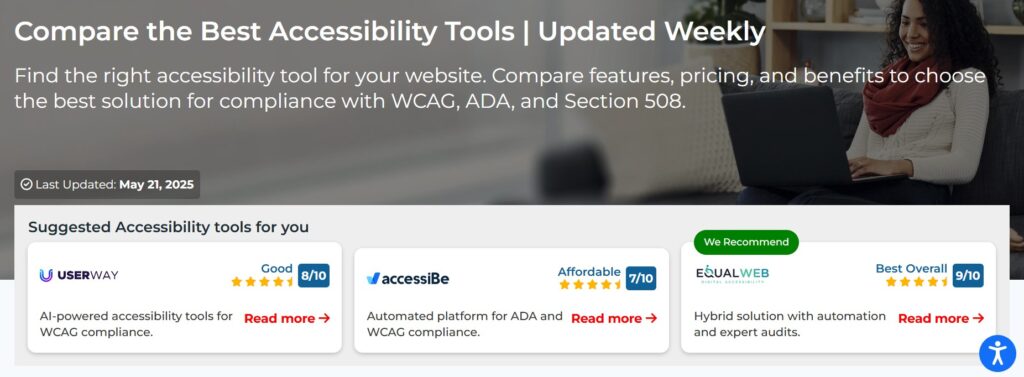
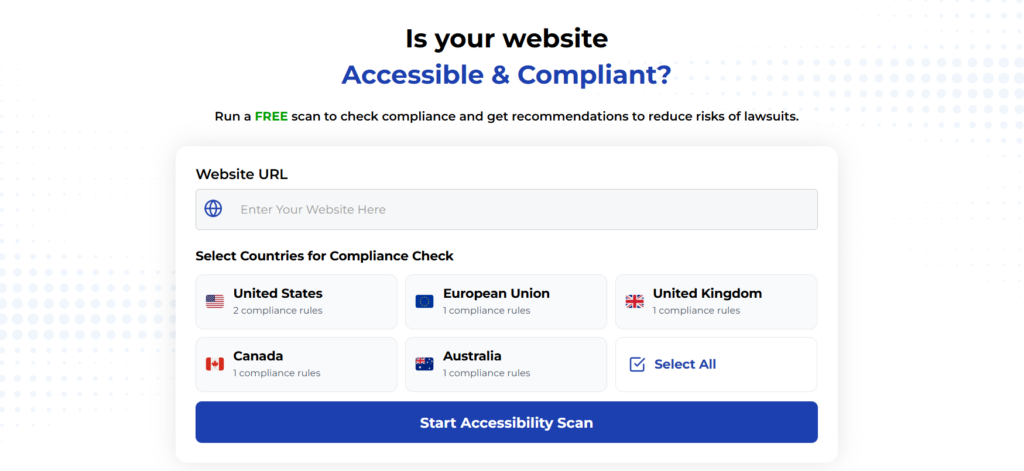
Using Automated Tools for Quick Insights (Accessibility-Test.org Scanner)
Automated testing tools provide a fast way to identify many common accessibility issues. They can quickly scan your website and point out problems that might be difficult for people with disabilities to overcome.
Visit Our Tools Comparison Page!
Run a FREE scan to check compliance and get recommendations to reduce risks of lawsuits
Final Thoughts
Stop guessing about the impact of your accessibility work and start measuring it. By setting up a dedicated accessibility dashboard and tracking the right metrics, you can gather the evidence needed to show that accessibility is a powerful driver of user engagement and profit. You can move the conversation from legal risk to business opportunity.
If you’re ready to start connecting your accessibility efforts to real financial returns, we can help. Explore our resources on setting up analytics and performing an accessibility audit to begin your journey. It’s time to show your organization the true value of an inclusive web.
Want More Help?
Try our free website accessibility scanner to identify heading structure issues and other accessibility problems on your site. Our tool provides clear recommendations for fixes that can be implemented quickly.
Join our community of developers committed to accessibility. Share your experiences, ask questions, and learn from others who are working to make the web more accessible.