


Google Analytics vs AccessiMetrics | A11y Showdown
Measuring how users interact with accessibility features on your website is essential for creating truly inclusive digital experiences. While standard analytics tools track page views and conversion rates, they often miss crucial data about how people with disabilities use your site. This article compares two approaches to accessibility analytics: using Google Analytics 4 (GA4) and dedicated accessibility measurement tools like AccessiMetrics. We’ll examine how each handles keyboard navigation tracking, screen reader usage data, and accessibility reporting capabilities to help you make an informed decision about which solution best fits your needs.
Understanding Accessibility Analytics Needs
Website analytics typically focus on clicks, conversions, and user paths. However, accessibility analytics requires tracking different interactions: keyboard navigation patterns, screen reader announcements, alternative text usage, and form completion rates for users with various disabilities. Without these insights, organizations remain in the dark about how accessible their digital properties truly are.
Traditional analytics tools weren’t built with accessibility in mind. They track mouse movements but miss keyboard navigation patterns, count video plays but don’t measure caption usage and track form submissions but can’t tell you if screen reader users abandoned your contact form due to unlabeled fields.
According to recent data, websites that fully implement video accessibility features see up to a 21% boost in search visibility and traffic. This improvement happens because search engines better understand accessible content, while users engage more deeply. Similar benefits likely extend to other accessibility features, but without proper tracking, these gains remain invisible.
Google Analytics 4 for Accessibility Tracking
Google Analytics 4 represents a significant evolution from previous versions, offering more flexibility for tracking custom events and user behaviors. While not designed specifically for accessibility monitoring, GA4’s event-based model makes it possible to track certain accessibility interactions with proper setup.
Basic Setup for Accessibility Tracking in GA4
Setting up GA4 for basic accessibility tracking requires creating custom events for specific user interactions. For example:
- Keyboard navigation events
- Screen reader detection (when possible)
- Caption activation on videos
- High contrast mode usage
- Text resize actions
According to search results, you can add your GA4 Measurement ID to tracking settings, which enables collection of accessibility widget usage data: “With access to real user data, you can organize, reorder, remove, and fine-tune accessibility to fit your users’ specific accessibility requirements”.
Limitations of Google Analytics for Accessibility
Despite its flexibility, GA4 has significant limitations for accessibility tracking:
- No native accessibility event tracking
- Cannot directly identify assistive technology users
- Limited visualization for keyboard navigation paths
- Privacy concerns with tracking assistive technology usage
- Requires custom development work for meaningful data collection
As noted in one search result: “No single tool can find all of a website’s issues, and that’s especially true when a tool isn’t actually designed to analyze accessibility”. GA4 provides general user behavior data but lacks the specialized features needed for thorough accessibility analysis.
AccessiMetrics | Specialized Accessibility Analytics
AccessiMetrics represents the category of dedicated accessibility analytics platforms designed specifically to track, measure, and report on accessibility-related user interactions. Unlike general-purpose analytics tools, these specialized solutions focus exclusively on accessibility metrics.
Key Features of Dedicated Accessibility Analytics
Specialized accessibility analytics tools typically offer:
- Built-in tracking for keyboard navigation patterns
- Detection capabilities for screen reader usage
- Focus state monitoring across pages
- Accessibility issue identification in user flows
- Compliance reporting dashboards
- Integration with accessibility testing tools
While GA4 requires extensive customization, dedicated tools come ready to track accessibility metrics out of the box. This makes them particularly valuable for organizations without specialized development resources or those needing immediate insights into accessibility usage patterns.
Integration Capabilities
Most accessibility analytics platforms offer straightforward integration options:
- JavaScript snippet installation
- WordPress plugin options
- Tag manager deployment
- API access for custom implementations
These integration methods make it relatively simple to add specialized tracking without extensive development resources, though they do represent an additional script loading on your pages.
Tracking Focus Indicators | Heatmaps for Keyboard Navigation
Keyboard navigation is essential for many users with disabilities. Tracking how these users move through your site using the Tab key and other keyboard controls provides critical insights into potential barriers.
How Keyboard Heatmaps Work
Keyboard heatmaps visualize the paths users take when navigating your site with a keyboard instead of a mouse. They show:
- Which elements receive focus in what order
- Where users spend time interacting
- Points where users abandon their journey
- Navigation patterns that differ from mouse users
According to one search result, specialized tools can visualize character distribution on different keyboard layouts: “Keyboard Heatmap Visualization showing character distribution on different keyboard layouts while you’re typing”. This type of visualization helps identify patterns in how keyboard users interact with web content.
GA4’s Approach to Keyboard Tracking
Google Analytics 4 doesn’t offer native keyboard navigation tracking or heatmap visualization. To track keyboard interactions in GA4, you need to:
- Create custom events for keyboard actions
- Use custom JavaScript to detect Tab key usage
- Manually code focus state tracking
- Build your own reporting dashboards
This approach requires significant development work and still lacks true heatmap visualization capabilities, making it difficult to truly understand keyboard navigation patterns.
AccessiMetrics’ Keyboard Navigation Analysis
Dedicated accessibility analytics tools typically offer built-in keyboard navigation tracking:
- Automatic focus order recording
- Visual heatmaps showing focus patterns
- Identification of focus traps and barriers
- Comparison of keyboard vs. mouse navigation paths
These features make it much easier to identify issues like focus traps, where keyboard users get stuck and can’t navigate further, or skipped focus states, where elements are bypassed entirely.
Practical Applications of Keyboard Heatmaps
Keyboard navigation heatmaps reveal:
- Whether users can access all interactive elements
- If focus order follows a logical sequence
- Where keyboard users struggle or abandon tasks
- How keyboard navigation differs from expected paths
This information helps prioritize fixes that make the most impact for keyboard users. For example, you might discover that keyboard users frequently abandon your checkout process at the shipping form-a clear indication of an accessibility barrier that needs fixing.
Screen Reader Metrics | Session Replays
Understanding how screen reader users experience your website provides essential insights for accessibility improvements. Session replays for screen reader users can reveal barriers invisible to sighted users.
Challenges in Tracking Screen Reader Usage
Tracking screen reader usage presents unique challenges:
- Screen readers operate at the browser level, making detection difficult
- Privacy concerns about identifying users with disabilities
- Technical limitations in capturing screen reader announcements
- Ethical considerations in tracking assistive technology
As one source notes, Google Analytics “doesn’t natively tag users based on disabilities or assistive technology usage – for good reason: privacy and ethics”. This makes screen reader tracking particularly challenging.
GA4 Capabilities for Screen Reader Analytics
Google Analytics 4 has significant limitations when it comes to screen reader tracking:
- No built-in detection for screen readers
- Limited ability to record screen reader announcements
- No specialized session replay features
- Privacy concerns with custom tracking attempts
While custom events could track some screen reader interactions, GA4 lacks the specialized capabilities needed for meaningful screen reader analytics.
AccessiMetrics’ Screen Reader Session Recording
Dedicated accessibility analytics platforms offer more robust screen reader tracking:
- Detection of common screen reader software (when permitted)
- Recording of elements as announced by screen readers
- Comparison of visual rendering vs. screen reader announcement
- Identification of elements missed by screen readers
These capabilities provide far more insight into the screen reader user experience, helping identify issues like missing alt text, improper ARIA attributes, or inaccessible interactive elements.
Privacy and Ethical Considerations
Any tracking of assistive technology usage raises important privacy and ethical concerns:
- Avoid personally identifying users with disabilities
- Obtain clear consent for tracking assistive technology
- Focus on patterns and trends rather than individual users
- Ensure compliance with privacy regulations
Responsible analytics practices should focus on improving accessibility without compromising user privacy or dignity.
Custom Reporting | Exporting Accessibility Compliance Data
Sharing accessibility data with stakeholders, developers, and compliance teams requires flexible reporting options. The ability to export data in useful formats makes accessibility improvements more actionable.
GA4 Export Capabilities
Google Analytics 4 offers several export options:
- CSV downloads of custom reports
- Data API access for custom integrations
- Scheduled email reports
- Google Data Studio visualizations
However, these exports lack accessibility-specific formatting and context. You’ll need to create custom report configurations to extract meaningful accessibility data.
AccessiMetrics’ Specialized Export Formats
Dedicated accessibility tools typically offer accessibility-focused exports:
- WCAG compliance reports
- Issue remediation task lists
- Accessibility audit documentation
- Executive summaries with accessibility scores
According to one search result: “With the Accessibility Checker Export add-on, you can export Accessibility Checker data to a CSV file for import into Excel, Google Sheets, your project management tool, or any other software that supports CSV import”.
Benefits of CSV Exports for Accessibility Documentation
CSV exports offer particular benefits for accessibility work:
- Easy import into project management tools
- Shareable format for cross-team collaboration
- Historical record for compliance documentation
- Data analysis capabilities in spreadsheet programs
As noted in another search result: “This feature allows you to perform detailed analyses, customize data presentations, collaborate effectively, and maintain comprehensive documentation”.
Integration with Project Management Workflows
Exporting accessibility data to project management systems helps:
- Assign accessibility issues to specific team members
- Track remediation progress over time
- Prioritize fixes based on impact and difficulty
- Document compliance efforts for legal purposes
According to search results: “Import Issues into GitHub or a project management tool and assign them to team members”. This workflow integration makes accessibility work more structured and accountable.
Implementation Complexity and Costs
The resources required to implement and maintain accessibility analytics vary significantly between general-purpose and specialized tools.
GA4 | Free But Complex
Google Analytics 4 offers some advantages:
- No direct cost for the platform
- Likely already implemented on your site
- Familiar interface for many teams
- Extensive documentation and community support
However, the hidden costs come in implementation:
- Custom development work to track accessibility events
- Ongoing maintenance of custom tracking code
- Building specialized reports and dashboards
- Training team members on accessibility data interpretation
For organizations with development resources, GA4 can be customized to track some accessibility metrics, but the implementation requires significant expertise.
AccessiMetrics | Specialized But Additional Cost
Dedicated accessibility analytics platforms have their own considerations:
- Subscription costs for the specialized service
- Simpler implementation with ready-made features
- Purpose-built reports and visualizations
- Less customization required
For many organizations, the direct cost of a specialized tool is offset by readuced development time and more actionable insights. The ROI comes from faster identification and remediation of accessibility issues.

User Privacy and Data Collection Ethics
Tracking any user behavior raises privacy concerns, but this is especially true when tracking users with disabilities.
Ethical Considerations in Accessibility Tracking
Responsible accessibility analytics must consider:
- Avoiding identification of users with specific disabilities
- Getting informed consent for tracking assistive technology
- Using data to improve experiences, not profile users
- Storing accessibility data securely and responsibly
As one search result notes, GA4 “doesn’t natively tag users based on disabilities or assistive technology usage – for good reason: privacy and ethics”.
Regulatory Compliance
Analytics implementations must comply with:
- GDPR and other privacy regulations
- Accessibility laws and regulations
- Industry-specific compliance requirements
- Organizational privacy policies
Balancing valuable insights with user privacy requires thoughtful implementation of any analytics solution.
Making the Right Choice for Your Organization
Choosing between Google Analytics and specialized accessibility analytics depends on several factors specific to your organization.
When GA4 Makes Sense
Google Analytics 4 might be the right choice if:
- You have strong development resources
- Budget constraints limit additional tools
- You need basic accessibility metrics integrated with general analytics
- Your team is already familiar with GA4
With proper customization, GA4 can provide valuable accessibility insights while keeping your analytics in one platform.
When Specialized Tools Are Better
Dedicated accessibility analytics tools make more sense when:
- You lack technical resources for custom GA4 development
- You need immediate insights without extensive setup
- Accessibility compliance is a major priority
- You require detailed accessibility reporting
For organizations with serious accessibility commitments, specialized tools offer faster implementation and more actionable data.
Hybrid Approaches
Many organizations benefit from combining approaches:
- Using GA4 for general user behavior tracking
- Adding specialized tools for accessibility-specific insights
- Integrating data between platforms when possible
- Leveraging each tool for its strengths
This hybrid approach provides comprehensive analytics while ensuring accessibility-specific metrics receive proper attention.
A11y Analytics in Practice | Real-World Applications
Beyond theoretical comparisons, let’s examine how accessibility analytics tools work in practice.
Identifying Form Completion Barriers
Analytics can reveal where users with disabilities abandon forms:
- Tracking form field interactions by keyboard users
- Measuring completion rates between mouse and keyboard users
- Identifying fields where screen reader users get stuck
- Comparing time to completion across different user groups
These insights help pinpoint specific form fields or interactions causing accessibility barriers.
Measuring the Impact of Accessibility Improvements
Analytics provides evidence of accessibility ROI:
- Before/after comparisons of user engagement
- Reduced abandonment rates after remediation
- Improved conversion rates among keyboard users
- Faster task completion times for all users
As one search result notes: “Recent data shows websites that fully implement video accessibility features see up to a 21% boost in search visibility and traffic”. Similar metrics can be tracked for other accessibility improvements.
Continuous Monitoring for Regression Prevention
Ongoing analytics helps maintain accessibility:
- Alerting when new barriers appear
- Tracking accessibility scores over time
- Identifying which code changes introduced problems
- Measuring long-term accessibility trends
According to one search result: “The Level Access Platform continuously monitors the accessibility of your digital properties through regular automated tests, so you can respond to any changes to accessibility as your experiences are updated with new features and content”.
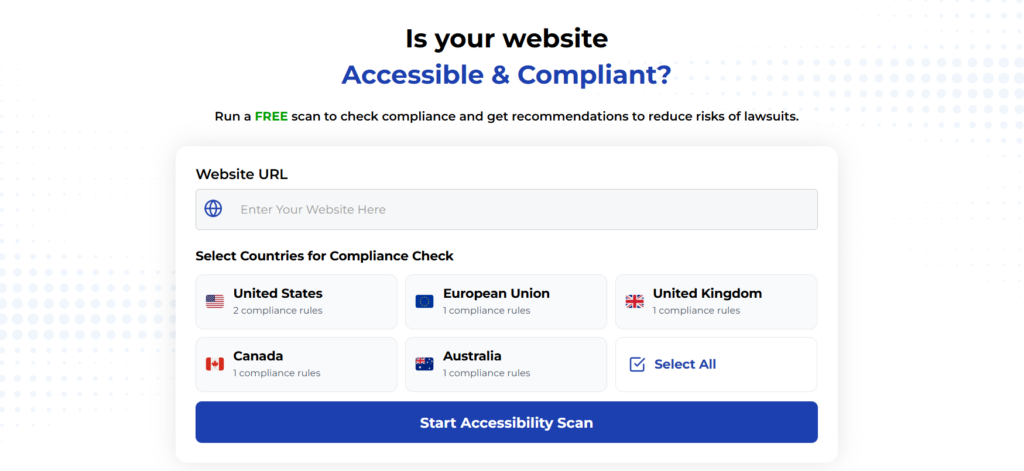
Using Automated Tools for Quick Insights (Accessibility-Test.org Scanner)
Automated testing tools provide a fast way to identify many common accessibility issues. They can quickly scan your website and point out problems that might be difficult for people with disabilities to overcome.
Visit Our Tools Comparison Page!
Run a FREE scan to check compliance and get recommendations to reduce risks of lawsuits
Key Metrics to Track Regardless of Platform
Whether using GA4 or a specialized tool, certain accessibility metrics provide valuable insights.
Essential Keyboard Navigation Metrics
Track how keyboard users navigate your site:
- Focus order pathways
- Tab key count to reach main content
- Focus traps and escape rates
- Keyboard vs. mouse task completion times
These metrics help identify barriers specific to keyboard users.
Critical Screen Reader Data Points
Understand screen reader user experiences:
- Screen reader announcement accuracy
- Navigation patterns using headings
- Form label recognition rates
- Alternative text usage and effectiveness
This data reveals how well your content translates to non-visual experiences.
Compliance Tracking Metrics
Monitor your overall accessibility status:
- WCAG success criteria pass/fail rates
- Accessibility issues by priority level
- Remediation progress over time
- Accessibility score trending
These metrics help track progress toward compliance goals and identify areas needing improvement.
Final Thoughts
Both Google Analytics 4 and specialized accessibility analytics tools have their place in an organization’s toolkit. GA4 offers flexibility and integration with broader analytics at the cost of implementation complexity, while dedicated accessibility tools provide specialized insights with less setup but at an additional cost.
The right choice depends on your organization’s specific needs:
- Technical resources available for implementation
- Budget constraints and priorities
- Depth of accessibility insights needed
- Integration requirements with existing systems
Many organizations find that starting with GA4’s basic accessibility tracking provides initial insights, while adding specialized tools later enhances their understanding of how users with disabilities experience their digital properties.
Whichever approach you choose, the key is to start measuring accessibility interactions now. Without data on how users with disabilities experience your site, accessibility improvements remain guesswork. With proper analytics in place, you can make informed decisions that truly improve the experience for all users.
Remember that analytics should drive action. Collect data not just to measure problems but to prioritize solutions that make your digital properties more accessible for everyone.
Want More Help?
Try our free website accessibility scanner to identify heading structure issues and other accessibility problems on your site. Our tool provides clear recommendations for fixes that can be implemented quickly.
Join our community of developers committed to accessibility. Share your experiences, ask questions, and learn from others who are working to make the web more accessible.