


Google Analytics 4 vs Hotjar vs FullStory | Accessibility User Behavior Tracking
Understanding how users with disabilities interact with websites requires specialized analytics approaches that go beyond traditional metrics. Most standard web analytics tools focus on page views, clicks, and conversion rates, but they miss critical data about how people with disabilities actually experience and navigate digital content. This creates a significant gap in understanding user behavior patterns for the 1.3 billion people worldwide who live with some form of disability.
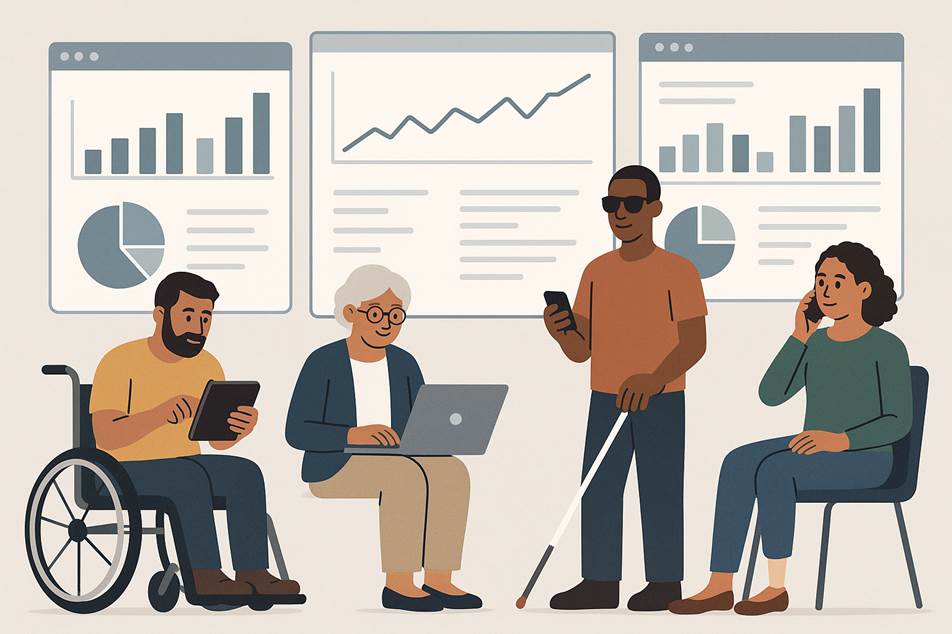
Diverse users with disabilities using technology while analytics track accessibility interactions
Understanding Accessibility Analytics Needs
Traditional analytics platforms weren’t designed with accessibility testing in mind. They track mouse movements but miss keyboard navigation patterns, count video plays but don’t measure caption usage, and track form submissions without revealing if screen reader users abandoned forms due to unlabeled fields. This limitation creates blind spots that prevent organizations from truly understanding their digital accessibility performance.
The business case for better accessibility analytics has never been stronger. Organizations that implement accessibility analytics report significant improvements in user engagement and conversions. Data shows that accessible websites typically see 37% lower bounce rates and 25% higher conversion rates compared to their non-accessible counterparts. For businesses, this translates directly into revenue growth and expanded market reach.
Why Standard Analytics Fall Short
Standard web analytics tools capture surface-level interactions but miss the nuanced ways people with disabilities use websites. Screen readers interact with web content differently than visual browsing, keyboard navigation follows distinct patterns from mouse usage, and voice control creates entirely different interaction flows. Without specialized tracking capabilities, these important user behaviors remain invisible to traditional analytics.
Privacy considerations add another layer of complexity to accessibility analytics. While organizations want to understand how assistive technology users interact with their content, directly tracking disability status raises significant ethical and legal concerns. The challenge lies in gathering actionable data while respecting user privacy and maintaining compliance with data protection regulations.
The Analytics Gap in Accessibility
Current accessibility testing typically relies on automated scans that identify technical violations but can’t measure actual user experience. Manual testing with real users provides valuable insights but doesn’t scale to capture broader behavioral patterns. This creates a need for analytics solutions that bridge the gap between technical compliance and real-world user experience measurement.
Google Analytics 4 for Accessibility Tracking
Google Analytics 4 (GA4) offers the most robust foundation for accessibility analytics through its custom event tracking capabilities. Unlike traditional analytics platforms, GA4 allows organizations to create detailed tracking for accessibility-specific interactions without compromising user privacy.
Accessibility Widget Integration
GA4 excels at tracking accessibility widget usage through measurement ID integration. Organizations using accessibility widgets can monitor exactly how users interact with features like font size adjustment, color contrast changes, and screen reader optimization tools. This data provides direct insights into which accessibility features users find most valuable and how frequently they’re used.
The platform tracks widget activation rates, feature click-through patterns, and user engagement with different accessibility profiles. This information helps organizations understand the return on investment for accessibility tools and identify which features deserve priority for future development.
Custom Event Framework
GA4’s custom event framework allows organizations to track accessibility-specific interactions without identifying individual users with disabilities. Teams can monitor keyboard navigation patterns by tracking Tab key usage, measure form accessibility through completion rates segmented by input method, and identify potential barriers through error tracking.
The platform supports real-time analytics, enabling organizations to monitor accessibility performance as it happens. This capability proves particularly valuable during website updates or accessibility remediation efforts, providing immediate feedback on whether changes improve or hinder user experience.
Limitations and Considerations
While GA4 provides excellent tracking capabilities, it cannot directly detect screen reader usage or identify users of assistive technology. This limitation stems from important privacy protections that prevent websites from accessing information about users’ assistive technology. Instead, GA4 relies on indirect measurement through behavioral patterns and custom event tracking.
The platform also lacks visual analytics capabilities like heatmaps or session recordings, which limits its ability to provide contextual understanding of accessibility barriers. Organizations using GA4 for accessibility analytics often need to supplement it with additional tools for complete coverage.
Hotjar’s Visual Analytics Approach
Hotjar takes a different approach to accessibility analytics through visual observation and session recording. While it doesn’t offer dedicated accessibility tracking features, its session recordings and heatmaps can reveal important patterns in how users with different abilities interact with websites.
Session Recording Capabilities
Hotjar’s session recordings capture keyboard navigation patterns, showing exactly how users tab through forms and interactive elements. These recordings can reveal accessibility barriers that automated testing tools miss, such as illogical tab order, missing focus indicators, or keyboard traps that prevent users from completing tasks.
The platform’s privacy controls allow organizations to suppress sensitive data while still capturing accessibility-relevant interactions. Advanced data suppression features ensure that personal information remains protected while preserving the behavioral data needed for accessibility analysis.
Heat Map Analysis
Hotjar’s click maps and scroll maps provide visual representations of user engagement that can identify accessibility issues. For example, click maps might reveal that users repeatedly click on non-interactive elements, suggesting poor visual design or insufficient accessibility markup. Scroll maps can show where users with different interaction methods stop engaging with content.
The platform tracks rage clicks and error clicks, which can indicate user frustration often associated with accessibility barriers. These frustration signals help teams prioritize which areas of their websites need accessibility improvements.
Mobile Accessibility Insights
Hotjar excels at mobile accessibility tracking through its mobile session recordings and touch interaction analysis. The platform captures pinch-to-zoom gestures, which often indicate that content isn’t properly sized for mobile accessibility. Mobile recordings also show how users navigate with assistive technology on touch devices.
Privacy protection features in Hotjar include advanced data masking and compliance with GDPR requirements. The platform allows organizations to balance data collection with privacy protection, particularly important when analyzing behavior patterns that might correlate with disability status.
FullStory’s Behavioral Data Platform
FullStory positions itself as a behavioral data platform that captures every user interaction for analysis. While not specifically designed for accessibility analytics, its session replay and search capabilities can provide valuable insights into accessibility user experience.
Session Replay and AI Analysis
FullStory’s session replay feature captures comprehensive user interactions, including keyboard navigation, form interactions, and error occurrences. The platform’s AI-powered analysis can automatically identify patterns and anomalies in user behavior that might indicate accessibility barriers.
One-click AI summaries help teams quickly identify key issues within lengthy user sessions, making it easier to spot accessibility problems without manually reviewing hours of recordings. This efficiency gain helps organizations scale their accessibility monitoring efforts.
Advanced Search and Segmentation
FullStory’s Omnisearch feature allows teams to find specific user sessions based on behavioral criteria that might correlate with accessibility needs. Organizations can search for sessions involving specific error types, extended session durations, or unusual navigation patterns that might indicate accessibility challenges.
The platform tracks custom events and provides detailed analytics on user interactions with forms, navigation elements, and other critical website components. This data helps teams understand how different user groups experience their digital properties.
Privacy and Data Protection
FullStory includes advanced privacy masking capabilities that protect sensitive user information while preserving behavioral data needed for analysis. The platform complies with privacy regulations and provides tools for managing data retention and user consent.
However, like other session recording platforms, FullStory cannot directly identify assistive technology usage and relies on behavioral inference rather than explicit disability tracking.
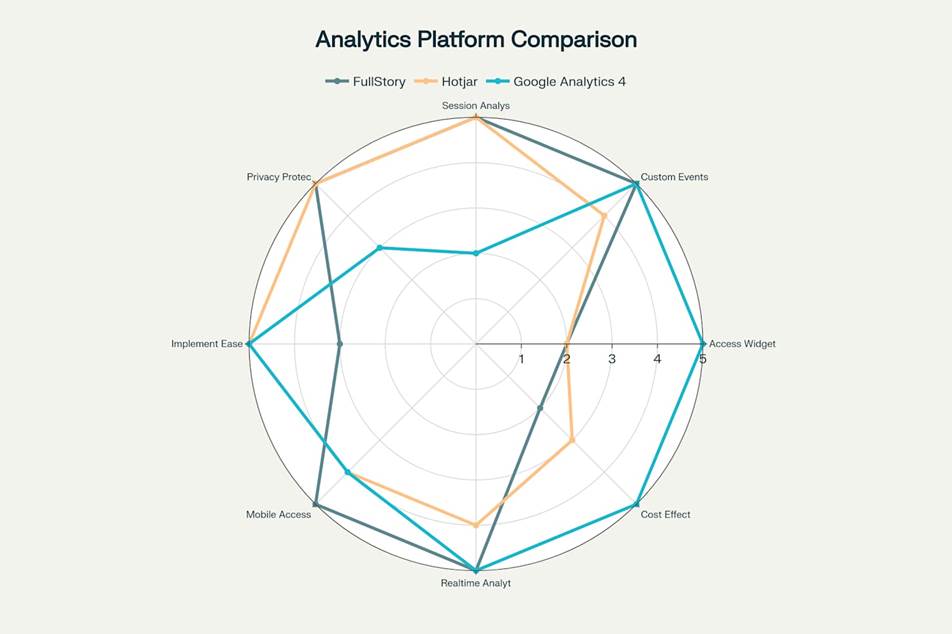
Accessibility Analytics Platform Comparison: GA4, Hotjar, and FullStory across 8 key capabilities
Privacy Considerations for Disability-Related Data
Tracking user behavior patterns that might correlate with disability status raises significant privacy and ethical concerns. Organizations must balance their need for accessibility insights with respect for user privacy and compliance with data protection regulations.
Ethical Analytics Approaches
The most ethical approach to accessibility analytics focuses on identifying barriers rather than identifying users. Instead of tracking who has disabilities, organizations should monitor whether their websites create barriers that could affect users with different abilities. This approach provides actionable insights while respecting user privacy.
Data minimization principles apply strongly to accessibility analytics. Organizations should collect only the data necessary to identify and fix accessibility barriers, avoiding unnecessary collection of personal information. Clear data retention policies and user consent mechanisms help ensure compliance with privacy regulations.
GDPR and Disability Data
Under GDPR, disability status constitutes sensitive personal data that requires explicit consent and additional protection. Organizations tracking accessibility-related behavior must ensure they have legal basis for processing this data and implement appropriate safeguards.
Privacy by design principles recommend building accessibility analytics systems that provide insights without collecting identifiable information about users’ disability status. This approach reduces privacy risks while still enabling organizations to improve their accessibility performance.
Building Trust Through Transparency
Transparent data practices build trust with users who rely on accessibility features. Organizations should clearly communicate what data they collect, how they use it for accessibility improvements, and what privacy protections they have in place. This transparency particularly matters for users with disabilities who may be more concerned about data privacy.
Implementation Complexity Analysis
The complexity of implementing accessibility analytics varies significantly across platforms, affecting both initial setup costs and ongoing maintenance requirements. Understanding these differences helps organizations choose solutions that match their technical capabilities and resource constraints.
Google Analytics 4 Implementation
GA4 offers the simplest implementation for basic accessibility tracking. Adding the tracking code requires minimal technical expertise, and setting up custom events for accessibility features can be accomplished by most web developers. The platform’s free tier makes it accessible to organizations with limited budgets.
Advanced accessibility tracking in GA4 requires more sophisticated implementation, including custom event configuration and dashboard setup. Organizations need developers familiar with GA4’s event tracking system to create meaningful accessibility analytics. However, once properly configured, the system requires minimal ongoing maintenance.
Hotjar Setup Requirements
Hotjar implementation requires adding a single script to websites, making initial setup straightforward. However, configuring privacy controls and data suppression features for accessibility compliance requires more technical knowledge. Organizations must carefully configure what data to capture and what to suppress.
Session recording analysis for accessibility insights requires human interpretation, adding ongoing resource requirements. Teams need training to identify accessibility barriers in session recordings and translate observations into actionable improvements. This human element increases the total cost of ownership compared to automated solutions.
FullStory Configuration
FullStory implementation involves more complex setup and configuration compared to other platforms. The platform requires careful planning of data capture policies, privacy settings, and custom event tracking. Implementation complexity increases for organizations with multiple websites or complex technical architectures.
The platform’s advanced features require training for effective use. Teams need to understand how to use Omnisearch, set up custom events, and interpret behavioral data for accessibility insights. This learning curve can extend implementation timelines and increase costs.
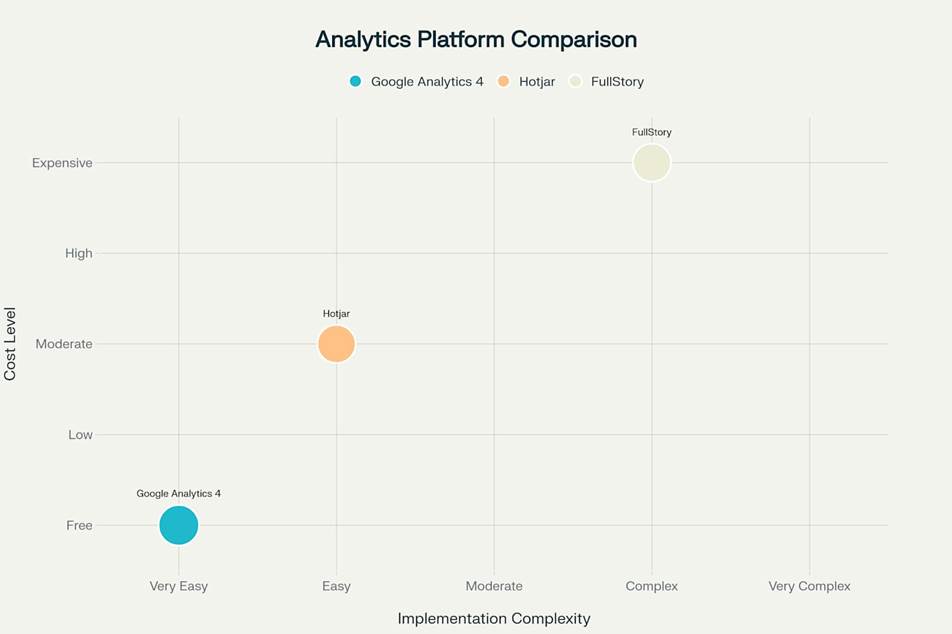
Platform Comparison | Implementation Complexity vs Cost with Overall Capability
Measuring ROI and Business Impact
Organizations implementing accessibility analytics report measurable returns on investment through improved user engagement, reduced legal risks, and expanded market reach. Understanding these benefits helps justify analytics investments and secure ongoing support for accessibility initiatives.
Revenue Impact from Accessibility Improvements
Accessible websites consistently demonstrate higher conversion rates and lower bounce rates compared to non-accessible sites. Data shows that organizations implementing WCAG 2.1 AA standards see average conversion rate improvements of 25% and bounce rate reductions of 37%. These improvements translate directly to increased revenue and customer acquisition.
The global disability market represents $13 trillion in annual spending power, including families and friends of people with disabilities. Organizations that fail to make their websites accessible miss opportunities to serve this significant market segment. Analytics help organizations understand how accessibility improvements expand their customer base.
Cost-Benefit Analysis
Accessibility analytics investments typically show positive returns within the first year of implementation. The average return on accessibility investments reaches $12 for every dollar spent, making accessibility one of the highest-ROI improvements organizations can make.
Legal risk reduction provides another significant benefit. ADA-related website lawsuits continue increasing, with organizations facing average settlement costs in the hundreds of thousands of dollars. Accessibility analytics help organizations identify and fix barriers before they result in legal action.
Performance Metrics That Matter
Key performance indicators for accessibility analytics include issue resolution time, user satisfaction scores, and accessibility compliance ratings. Organizations tracking these metrics can demonstrate concrete progress and justify continued investment in accessibility initiatives.
Mobile accessibility improvements show particularly strong returns, with accessible mobile sites demonstrating 30% faster load times and significantly better user engagement. As mobile traffic continues growing, these improvements become increasingly valuable for business performance.
Case Studies and Real-World Results
Real-world implementations of accessibility analytics demonstrate the practical benefits organizations achieve through better measurement and data-driven improvements. These examples show how different organizations use analytics to drive accessibility success.
Legal & General’s Transformation
Legal & General Group implemented accessibility analytics and saw remarkable results within 24 hours of making initial fixes. Their traffic from search engines increased by 25% immediately, growing to 50% within three months. The organization achieved 100% return on investment within one year, demonstrating the rapid payback possible from accessibility improvements.
The company’s approach focused on using analytics to identify the highest-impact accessibility barriers first. By prioritizing fixes based on user behavior data, they maximized the benefit of their accessibility investments. This data-driven approach enabled them to achieve faster results than traditional audit-based remediation.
Enterprise Technology Success
A major cybersecurity company used accessibility analytics tools to achieve $10 million in additional annual profit. The organization’s focus on accessibility contributed to a 17% increase in overall monthly web traffic and a 40% increase in organic traffic. Accessibility improvements alone generated $100,000 in additional annual revenue.
The company maintained over 11 websites with 4,200 pages, making manual accessibility monitoring impossible. Analytics tools enabled them to monitor accessibility at scale while reducing bounce rates by 17%. This efficiency gain contributed $7.2 million per year in additional operating profit.
E-commerce Results
Online retailers implementing accessibility analytics report significant improvements in customer engagement and sales. GadgetShop reduced their bounce rate from 68% to 42% after making accessibility improvements guided by analytics data. The company attributed increased sales directly to users staying longer and viewing more products.
FashionFwd focused on accessibility features for older users and saw a 28% increase in sales from customers over 65. This demographic represented a virtually untapped market before accessibility improvements. Analytics helped the company identify which features most benefited this user group.
Form Accessibility Impact
CloudServe’s B2B services company rebuilt their contact forms with accessibility in mind, guided by analytics showing high abandonment rates. After implementing proper labels and better error handling, form submissions increased by 36% in the following month. No other marketing changes accompanied this improvement, isolating the impact of accessibility enhancements.
Form accessibility improvements consistently show some of the strongest ROI among accessibility initiatives. Analytics help organizations identify which forms create barriers and prioritize fixes that will most improve conversion rates.
Making the Right Choice for Your Organization
Selecting the right accessibility analytics platform depends on organizational needs, technical capabilities, and budget constraints. Each platform offers distinct advantages that align with different use cases and implementation requirements.
When to Choose Google Analytics 4
GA4 works best for organizations that need cost-effective accessibility widget tracking and custom event analytics. Its free tier makes it accessible to nonprofits and small businesses with limited budgets. The platform excels when organizations have dedicated accessibility widgets and want to track feature usage in detail.
Organizations with strong technical teams can leverage GA4’s custom event framework to create sophisticated accessibility tracking systems. The platform’s real-time analytics capabilities support organizations that need immediate feedback during accessibility remediation efforts.
Hotjar for Visual Insights
Hotjar provides the best solution for organizations that need visual context about accessibility barriers. Session recordings help teams understand exactly how users navigate websites and where they encounter difficulties. The platform works well for smaller websites where human analysis of recordings is feasible.
Organizations concerned about privacy can leverage Hotjar’s advanced data suppression features to protect user information while capturing accessibility-relevant behavior. The platform’s heatmaps help identify design issues that create accessibility barriers.
FullStory for Advanced Analysis
FullStory suits large organizations with complex websites that need sophisticated behavioral analysis. The platform’s AI-powered insights and advanced search capabilities help teams identify accessibility patterns across large amounts of user data.
Organizations with dedicated accessibility teams can benefit from FullStory’s detailed session replay and custom event tracking. The platform’s enterprise features support organizations that need to monitor accessibility across multiple websites and user segments.
Budget and Resource Considerations
Implementation costs vary significantly across platforms. GA4 offers the lowest barrier to entry but may require more custom development for advanced features. Hotjar provides good value for organizations that need visual analytics but requires human resources for session analysis.
FullStory represents the highest investment but offers the most advanced analytical capabilities. Organizations should evaluate the total cost of ownership, including implementation, training, and ongoing analysis requirements.
Actionable Steps for Implementation
Starting accessibility analytics requires a structured approach that balances immediate wins with long-term strategic goals. Organizations should begin with clear objectives and gradually expand their analytics capabilities.
Setting Up Basic Tracking
Begin with fundamental accessibility tracking that provides immediate insights. Set up custom events for form completion rates, error occurrences, and navigation patterns. These basic metrics establish baseline performance and identify obvious improvement opportunities.
Document current accessibility performance before implementing changes. This baseline enables organizations to measure the impact of improvements and demonstrate ROI to stakeholders. Regular measurement helps teams identify trends and adjust strategies based on data.
Building Analytics Maturity
Expand analytics capabilities gradually as teams develop expertise and processes. Advanced features like behavior segmentation and predictive analytics require more sophisticated implementation but provide deeper insights. Organizations should match their analytics complexity to their ability to act on the insights generated.
Train team members to interpret accessibility analytics data and translate insights into actionable improvements. This capability building ensures organizations can maximize the value of their analytics investments.
Continuous Improvement Process
Establish regular review cycles to assess accessibility analytics data and plan improvements. Monthly or quarterly reviews help organizations stay on top of emerging accessibility barriers and track progress toward goals. This structured approach prevents accessibility from becoming an afterthought in the development process.
Connect accessibility analytics to broader business metrics to demonstrate impact. Showing the relationship between accessibility improvements and business outcomes helps secure ongoing support and resources for accessibility initiatives.
Using Automated Tools for Quick Insights (Accessibility-Test.org Scanner)
Automated testing tools provide a fast way to identify many common accessibility issues. They can quickly scan your website and point out problems that might be difficult for people with disabilities to overcome.
Visit Our Tools Comparison Page!
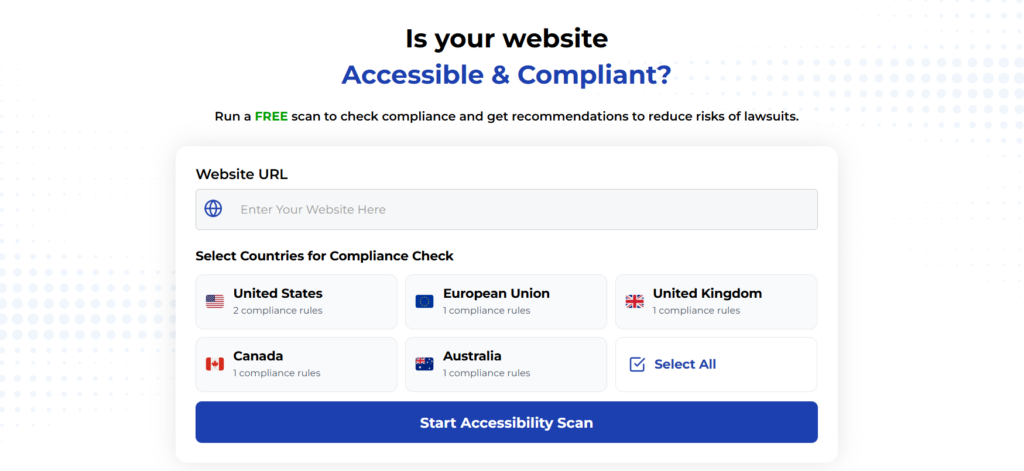
Run a FREE scan to check compliance and get recommendations to reduce risks of lawsuits
Final Thoughts
Accessibility analytics represents a fundamental shift from compliance-focused accessibility to user-experience-driven inclusion. Organizations that implement proper analytics can identify barriers, measure improvements, and demonstrate the business value of accessibility investments.
Google Analytics 4, Hotjar, and FullStory each offer unique strengths for accessibility tracking. GA4 provides cost-effective custom event tracking, Hotjar offers visual insights through session recordings, and FullStory delivers advanced behavioral analysis capabilities. The right choice depends on organizational needs, technical capabilities, and budget constraints.
The business case for accessibility analytics continues strengthening as organizations recognize the revenue potential of inclusive design. With 97% of websites still containing accessibility barriers, organizations that invest in proper measurement and improvement gain significant competitive advantages. Analytics provide the data foundation needed to turn accessibility from a compliance requirement into a strategic business advantage.
Success in accessibility analytics requires commitment to privacy protection, user-centered design, and continuous improvement. Organizations that adopt these principles while implementing robust measurement systems position themselves to serve all users effectively while achieving strong business results.
Want More Help?
Try our free website accessibility scanner to identify heading structure issues and other accessibility problems on your site. Our tool provides clear recommendations for fixes that can be implemented quickly.
Join our community of developers committed to accessibility. Share your experiences, ask questions, and learn from others who are working to make the web more accessible.