


Creating Accessible
SVG charts and infographics have become essential tools for displaying data on websites. When created with accessibility in mind, these visual elements can be usable by everyone, including people with disabilities. Making SVG charts accessible involves careful planning, proper structure, and attention to interactive elements. This article explains practical techniques to create SVG charts and infographics that work well for screen reader users, keyboard navigators, and people with various disabilities. By implementing these approaches, you can ensure your data visualizations reach all users effectively.
Structural Accessibility
The foundation of accessible SVG charts begins with proper structure. Well-structured SVGs provide essential context and information to assistive technology users. Without structural accessibility, your charts might appear as meaningless shapes or be completely invisible to some users.
ARIA Role Annotation
Adding appropriate ARIA (Accessible Rich Internet Applications) roles to SVG elements helps assistive technologies understand their purpose. ARIA roles act as labels that identify what different parts of your chart represent.
For charts, use the img role for the overall SVG when it functions as an image. When your SVG contains interactive elements, use more specific roles like button, checkbox, or link for those components. Group related elements using the group role to create logical sections within your chart.
When creating a bar chart, for example, each bar could have a role of graphics-symbol with additional attributes that describe its value and meaning. This helps screen reader users understand that the element represents data rather than just a rectangle.
Including appropriate ARIA roles doesn’t require much additional effort but makes a significant difference in how assistive technologies interpret your charts. Many screen readers announce these roles, helping users understand what they’re encountering as they navigate through the content.

Text Alternative Strategies
Text alternatives are essential for conveying the meaning of visual elements to people who can’t see them. With SVG charts, several text alternative strategies work together to create a complete experience.
The title element provides a brief label for SVG components. Each important element in your chart should have a title that identifies what it represents. For instance, each bar in a bar chart could have a title with the category and value it represents.
The desc element offers more detailed descriptions. Use it to explain what the entire chart shows, including trends, comparisons, or key insights. Make sure this description captures the main point of your visual to give context to users who can’t see it.
A third approach involves creating an alternative text section near the chart. This can include a data table showing the same information presented in the chart, allowing users to access the raw data. This method benefits not only screen reader users but also people who process information better through text than visuals.
Combining these strategies creates layers of information that different users can access based on their needs and preferences. Remember that good text alternatives focus on meaning rather than appearance—describe what the data shows, not just the colors and shapes used.
Coordinate System Labels
Charts rely on coordinate systems to position data points, but these can be meaningless without proper labeling. Accessible SVG charts need clear labels for axes, scales, and reference points.
For axes, include text elements that clearly state what each axis represents. For example, a chart tracking temperature changes should label the x-axis as “Time” and the y-axis as “Temperature in Degrees Celsius.” Position these labels where they’re visually associated with their axes.
Scale markings need clear values. Include text for major points on your scale, such as “0,” “50,” “100,” etc. These markings help all users interpret the magnitude of values shown in the chart.
For complex charts, consider adding grid lines with appropriate ARIA attributes to help users trace across the chart. This helps people with partial vision or cognitive disabilities track data points across the visualization.
Make these labels part of the SVG structure rather than rendering them as background images. This ensures they’re properly connected to the chart elements and accessible to assistive technologies.
When designing coordinate labels, maintain sufficient color contrast between text and background. Small, low-contrast axis labels are common accessibility failures in charts. Aim for a contrast ratio of at least 4.5:1 for normal text and 3:1 for large text.
Interactive Features
Modern data visualizations often include interactive elements that let users explore data points, toggle between views, or access additional information. Making these interactions accessible requires careful implementation.
Data Point Focus Management
Keyboard focus management ensures that users can navigate to all interactive elements without a mouse. This is crucial for people with motor disabilities and screen reader users.
Make interactive data points focusable by adding tabindex=”0″ to elements that should receive keyboard focus. Create a logical tab order that follows the natural reading order of the chart—typically left to right, top to bottom.
Provide visible focus indicators that appear when users tab to interactive elements. These indicators should have sufficient contrast against the background and surrounding elements. Avoid relying solely on color changes for focus indicators; use outlines, underlines, or shape changes as well.
When a user focuses on a data point, provide feedback through both visual and programmatic means. Visually, you might enlarge the point or change its appearance. Programmatically, update accessible names or descriptions to provide additional context about the selected point.
For charts with many data points, consider implementing shortcut keys that let users jump between significant points or sections. For example, allow users to press the Home key to focus on the first data point or the End key to reach the last one.
Remember that keyboard navigation should never trap users within the chart. Always ensure there’s a way to tab out of the chart and continue navigating the rest of the page.
Dynamic Content Updates
Many modern charts update dynamically based on user interactions or changing data. These updates must be accessible to all users, including those using assistive technologies.
Use ARIA live regions to announce important changes to screen reader users. For critical updates, such as when selecting a new data view changes the entire chart, use aria-live=”assertive” to interrupt the user with the new information. For less critical updates, like hovering over a data point to see its exact value, use aria-live=”polite” to announce the information when the user isn’t busy with other tasks.
When the chart updates, also update associated text alternatives to reflect the new state. This ensures users relying on these descriptions get accurate information about the current view.
Provide clear indicators of loading states when charts take time to update. Both visual users and screen reader users should understand when data is being processed. Use appropriate ARIA attributes like aria-busy=”true” during loading periods.
Animation can be useful for showing transitions between states, but always provide ways to pause, stop, or control the speed of these animations. Some users may experience discomfort with rapid movements or flashing effects, while others may need more time to process changes.
Finally, maintain interaction history so users can return to previous states. This helps users who might accidentally trigger an update or who need to compare different views of the data.
Implementation Patterns
Choosing the right technical approach for your charts affects how accessible they can be. Different implementation patterns offer various advantages and challenges for accessibility.
SVG vs Canvas Comparison
When creating charts for the web, developers often choose between SVG and Canvas. From an accessibility standpoint, SVG generally offers significant advantages.
SVG (Scalable Vector Graphics) creates an actual DOM (Document Object Model) for each element in the graphic. This means screen readers can access individual elements within the chart. Each bar, line, or point can have its own accessible name, description, and interactive properties. SVG elements also naturally receive keyboard focus, making them easier to navigate.
Canvas, in contrast, renders graphics as a single flat bitmap. The entire chart is essentially one image, with no inherent structure for assistive technologies to detect. Making Canvas charts accessible requires building a parallel accessibility structure using ARIA and JavaScript, which is more complex and prone to breaking.
SVG also scales better across devices and zoom levels. Users who need to enlarge the content will find that SVG charts remain crisp and clear, while Canvas elements may become pixelated when enlarged.
However, Canvas may perform better for charts with thousands of data points. In these cases, you might use Canvas for rendering but create an accessible overlay using SVG or HTML elements that provide access to the key information represented in the chart.
For most web charts and infographics, SVG provides the best foundation for accessibility with less development effort.

Animation Considerations
Animations in charts can help users understand data transitions or highlight important information. However, they require careful implementation to ensure accessibility.
First, respect user preferences for reduced motion. Check for the prefers-reduced-motion media query and provide alternative, non-animated presentations for users who have indicated they prefer minimal animation. This helps people with vestibular disorders who may experience discomfort or nausea from movement on screen.
For essential animations, keep the duration brief and the motion simple. Avoid complex movements or rapid flashing effects that could trigger seizures in people with photosensitive epilepsy. Follow the WCAG guideline of avoiding content that flashes more than three times per second.
Provide controls that let users pause, stop, or restart animations. Place these controls in a logical location near the chart and make them keyboard accessible. Consider auto-pausing animations when users begin interacting with the chart.
When using animations to show data changes, also provide text descriptions of these changes for screen reader users. For example, if an animation shows a value increasing over time, make sure this trend is also conveyed through accessible text.
Remember that some users may miss animations entirely, so don’t rely on them as the only way to convey important information. Always provide static alternatives that communicate the same message.
Testing Accessible SVG Charts
Creating accessible charts is only half the battle; testing them properly ensures they actually work for all users.
Screen Reader Testing Approaches
Testing with screen readers reveals how assistive technology users will experience your charts. This testing should be systematic and thorough.
Start by navigating to the chart using only keyboard commands. Can you reach the chart easily? Once there, does the screen reader announce a meaningful title that identifies what the chart represents? This initial announcement sets the context for the entire chart experience.
Next, explore individual chart elements. For each data point or significant element, check that the screen reader announces meaningful information. Bar charts should announce values and categories for each bar. Line charts should provide information about data points and trends. Pie charts should announce percentages or values along with their categories.
Test interactive features by activating them with keyboard commands. When you select a data point, does the screen reader announce the updated information? When you toggle between different views, is the change clearly announced?
Different screen readers may interpret SVG content differently. Test with multiple screen readers, such as NVDA, JAWS, and VoiceOver, to ensure broad compatibility. What works perfectly in one screen reader might fail in another due to different interpretation of ARIA attributes or SVG structures.
Document all issues discovered during testing and categorize them by severity. Focus first on fixing problems that completely block access to information, then address issues that make the experience difficult but not impossible.
Keyboard Navigation Testing
Testing keyboard navigation verifies that users can interact with your chart without using a mouse or touch screen.
Start at the top of the page and press Tab repeatedly until you reach the chart. Note how many tab stops it takes to reach the chart—if it’s excessive, consider adding a skip link that lets users jump directly to the chart.
Once at the chart, verify that tab order follows a logical pattern. In Western languages, this typically means left to right, top to bottom. The tab order should reflect how a sighted user would naturally scan the visual.
Check that focus indicators are clearly visible against the chart background. Can you easily tell which element currently has focus? The indicator should have sufficient contrast and size to be noticeable without being distracting.
Test all interactive features using only the keyboard. Can you activate buttons, toggle data views, and access tooltips without a mouse? Document any functions that can’t be performed with keyboard alone and prioritize fixing these issues.
For charts with many data points, test whether keyboard shortcuts are available for moving efficiently through the content. Can users press Home to reach the first element or End to reach the last? Are there ways to move by category or section rather than tabbing through every individual element?
Finally, verify that keyboard focus never becomes trapped within the chart. Users should always be able to tab out and continue navigating the rest of the page.

Common Accessibility Challenges with SVG
Despite best efforts, certain accessibility challenges frequently arise with SVG charts. Being aware of these common issues helps you address them proactively.
Color Contrast and Visual Accessibility
Color choices significantly impact chart accessibility for users with low vision or color blindness. Poor contrast makes it difficult to distinguish between elements or read labels.
Maintain sufficient contrast between chart elements and the background, aiming for a ratio of at least 3:1 for graphical objects that convey information. For text elements within charts, including labels and legends, maintain a contrast ratio of at least 4.5:1 against their background.
Avoid relying solely on color to convey information. When showing different data series, use multiple visual indicators like patterns, shapes, or line styles along with color. For example, a line chart might use both different colors and different line patterns (solid, dashed, dotted) to distinguish between data series.
Test your charts with color blindness simulators to verify they remain understandable for people with various types of color vision deficiencies. Tools like Colorblindly and Color Oracle let you see how your charts appear to people with protanopia, deuteranopia, and tritanopia.
Consider providing high-contrast mode options for your charts. This could be a toggle that switches the chart to a simpler, higher-contrast color scheme optimized for users with low vision.
Include text legends that explicitly name the colors used and what they represent. This helps users who may perceive colors differently still understand what each element represents.
Text Scaling Issues
Users who need larger text often adjust their browser settings to increase font size. SVG charts need to handle this gracefully to remain accessible.
Make sure text elements within SVG use relative units like ’em’ rather than fixed pixel sizes. This allows text to scale when users change their browser’s font size settings. Test your charts by increasing the browser’s font size to 200% and checking whether labels remain readable and properly positioned.
When text scales up, provide sufficient space to prevent overlapping. This might mean dynamically adjusting the chart layout when text size increases. For complex charts, consider switching to a simplified version when text scaling is detected.
For charts with many text labels, implement smart label positioning that prevents overlaps. This might include rotating labels, abbreviating them, or showing them on demand when hovering over elements.
Be cautious with embedded text in SVG. Text that’s converted to paths won’t respond to browser text scaling settings. Keep important text as actual text elements rather than converting to outlines or paths.
Mobile Accessibility Considerations
Charts viewed on mobile devices present additional accessibility challenges due to smaller screens and touch interfaces.
Design charts to be responsive, automatically adjusting their layout and detail level based on screen size. On smaller screens, consider showing simplified versions with fewer data points or combining categories to prevent overcrowding.
Touch targets for interactive elements should be sufficiently large—at least 44 by 44 pixels—to accommodate users with motor control difficulties. Spacing between touch targets should prevent accidental activation of adjacent elements.
For complex charts on mobile devices, consider progressive disclosure. Show the most important information initially, with options to expand or explore additional details. This prevents overwhelming users with too much information on a small screen.
Test your charts with mobile screen readers like VoiceOver for iOS and TalkBack for Android. The touch-based interaction model of these screen readers differs from keyboard navigation, so specific testing is necessary to ensure compatibility.
Consider the impact of device orientation changes. When users rotate their device, the chart should adjust appropriately without losing information or requiring the user to reorient themselves.
Real-World Benefits of Accessible Charts
Beyond legal compliance, making SVG charts accessible offers tangible benefits for organizations and all users.
Improved User Experience for Everyone
Accessible charts deliver better experiences for all users, not just those with disabilities. The clarity and structure required for accessibility result in better information design overall.
When charts include clear labels, logical organization, and meaningful descriptions, they become easier for everyone to understand—including people in a hurry, those using small screens, and those in distracting environments. The principles of accessible design lead naturally to better communication of data.
Interactive features that work well with keyboards often work better for all users. Large touch targets that accommodate motor disabilities also help users with large fingers or those using devices while in motion.
Text alternatives that benefit screen reader users also help in situations where images can’t load or when users search for specific data. These descriptions make your content more discoverable and usable in various contexts.
By designing for accessibility from the start, you create charts that communicate more effectively across different situations and user needs. This universal design approach results in content that adapts well to different contexts and preferences.
Legal Compliance Benefits
Creating accessible SVG charts helps organizations meet legal requirements regarding digital accessibility. Many countries have laws requiring accessible digital content.
In the United States, the Americans with Disabilities Act (ADA) has been interpreted to apply to websites and digital content. Organizations have faced lawsuits when their online content, including data visualizations, wasn’t accessible to people with disabilities. Making charts accessible helps reduce legal risk under the ADA.
Section 508 requirements apply to federal agencies and organizations receiving federal funding. These regulations explicitly require accessible digital content, including charts and graphs. Meeting these requirements is often necessary for government contracts.
The European Union’s Web Accessibility Directive requires public sector websites and applications to be accessible. This includes making data visualizations perceivable and operable by people with disabilities.
By proactively addressing chart accessibility, organizations demonstrate due diligence in meeting these legal requirements. This can help prevent complaints, reduce legal expenses, and avoid potential damage to reputation from accessibility lawsuits.

Business Advantages
Beyond legal compliance, accessible SVG charts offer significant business benefits that impact the bottom line.
First, accessible charts reach a wider audience. Approximately 15% of the global population lives with some form of disability. By making charts accessible, you ensure your data reaches this substantial market segment rather than excluding potential customers or users.
Accessible charts also perform better in search engine results. The text alternatives and semantic structure required for accessibility provide additional content for search engines to index. This can improve your content’s visibility in search results, driving more traffic to your site.
The development discipline required for accessibility often results in cleaner, more maintainable code. This reduces technical debt and makes future updates easier and less costly. Structure that works well for accessibility typically works well for automated processing and data extraction as well.
Finally, embracing accessibility demonstrates corporate social responsibility. Organizations known for inclusive practices often enjoy enhanced brand reputation, improved employee morale, and stronger customer loyalty. Making accessibility a priority shows a commitment to serving all users fairly.

Navigation and WCAG Compliance
The Web Content Accessibility Guidelines (WCAG) include several requirements specifically relevant to navigation.
Keyboard Accessibility Requirements
WCAG 2.1 includes multiple success criteria related to keyboard accessibility:
- 2.1.1 Keyboard (Level A): All functionality must be operable through a keyboard interface
- 2.1.2 No Keyboard Trap (Level A): Keyboard focus must not become trapped in any element
- 2.1.4 Character Key Shortcuts (Level A): If a keyboard shortcut uses only letter, punctuation, number, or symbol characters, users must be able to turn it off or remap it
These requirements ensure that users who can’t use a mouse can still navigate your website effectively.
Focus Visibility Requirements
WCAG also addresses how focus should be indicated:
- 2.4.7 Focus Visible (Level AA): Any keyboard operable user interface must have a mode where the keyboard focus indicator is visible
- 2.4.11 Focus Appearance (Level AAA): The focus indicator must have sufficient size and contrast
These requirements ensure that keyboard users can track their position on the page.
Structure and Context Requirements
Other WCAG success criteria relate to navigation structure and context:
- 2.4.4 Link Purpose (In Context) (Level A): The purpose of each link should be clear from the link text or context
- 2.4.5 Multiple Ways (Level AA): More than one way must be available to locate a webpage
- 2.4.8 Location (Level AAA): Information about the user’s location within a set of web pages must be available
These requirements help users understand where they are and how to get where they want to go.
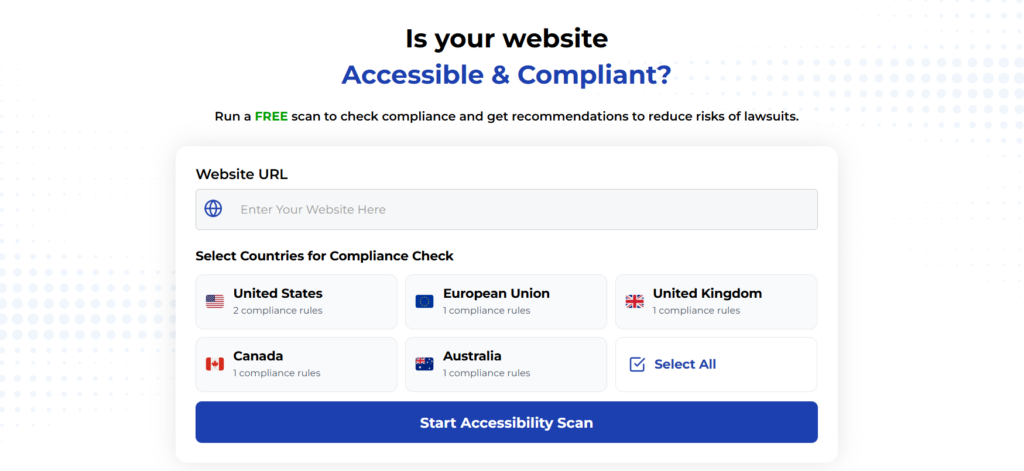
Using Automated Tools for Quick Insights (Accessibility-Test.org Scanner)
Automated testing tools provide a fast way to identify many common accessibility issues. They can quickly scan your website and point out problems that might be difficult for people with disabilities to overcome.
Visit Our Tools Comparison Page!
Run a FREE scan to check compliance and get recommendations to reduce risks of lawsuits
To Conclude Accessible SVG Charts and Infographics
Creating accessible SVG charts and infographics requires attention to structure, interactive features, and testing. By implementing proper ARIA roles, providing text alternatives, and ensuring keyboard accessibility, you make your data visualizations usable by everyone, including people with disabilities.
The techniques outlined in this article help you create charts that work well with screen readers, keyboard navigation, and other assistive technologies. These practices not only improve accessibility but also enhance the overall quality and usability of your data visualizations.
Remember that accessibility is an ongoing process. Test regularly with real users and assistive technologies to identify areas for improvement. As web technologies evolve, continue learning and adapting your approach to maintain accessible charts.
By making your SVG charts and infographics accessible, you ensure that everyone can access and understand your data, regardless of their abilities or the tools they use to browse the web.
Run a FREE scan to check compliance and get recommendations to reduce risks of lawsuits.